French Gazole Prices Map
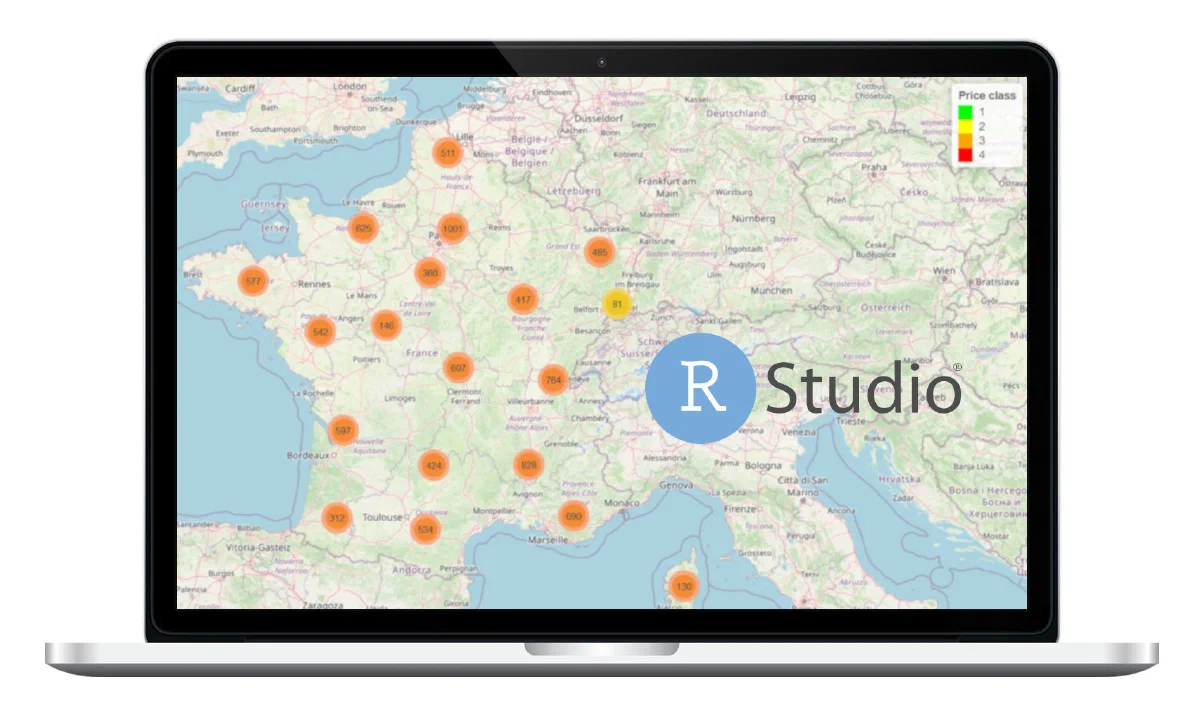
Map where we can easily identify the cheapest french gazole stations, made with leaflet in R.
Project overview Link to heading
Shiny application that utilizes advanced R programming techniques to gather and analyze critical data from French open data sources. The app retrieves real-time prices of “gazole” from across the entire country.
The data is obtained in a compressed format and then processed through data manipulation techniques to extract valuable insights in the form of a JSON file.
The application then employs data visualization techniques, using the Leaflet library, to provide an interactive and intuitive map-based interface, where users can easily identify the locations of gas stations and the corresponding prices, which are represented using a color-coded scale, ranging from low to high prices.
Tools used
- R
- RStudio
- shinyapps
- Leaflet
- Open Data
- JSON